PASSNYC: Data Science for Good
by Omar Baig
Posted on August 16, 2018 at 3:50 PM
Estimated Reading Time: 6 minutes

PASSNYC is a non-profit organization dedicated to aiding students in New York City schools prepare for the SHSAT exam. This exam is used to place students with high scores into New York’s prestigious specialized high schools. Over the years there has been a shift towards more homogenous demographics in these schools. The three most prestigious schools Stuyvesant, Bronx Science, and Brooklyn Tech-have Black and Hispanic student populations of 4, 9, and 13 percent, respectively, far below the 70 percent in public schools citywide. The goal of this analysis is to aid PASSNYC in targeting schools and increasing both SHSAT participation and preparation of Black and Hispanic students in order to shift the demographics to match the diversity of the great city.
PASSNYC Services
In order to maximize the usefulness of this analysis, the intent is to find the schools that have the most to gain from the specific PASSNYC services. These services include:
- Test Prep and Tutoring
- After School Programs
- Resources for Parents
- Mentoring
The Data
A set of data from 2016 of all schools in NYC will be used. This set includes ALL schools, including elementary schools. Because PASSNYC is focused on preparing students for the SHSAT, we will have to filter this down. Additionally another set of data containing the SHSAT registration and participation numbers will be used. These sets were provided by PASSNYC and can be found here on the original Kaggle competition page.
First lets get an idea of what schools are up for consideration. We can filter it down to only those middle schools with students able to take the SHSAT exam. This brings it from 1272 schools in the set to 626. Here we can see the cities with the most relevant schools are Brooklyn, Bronx, and New York.

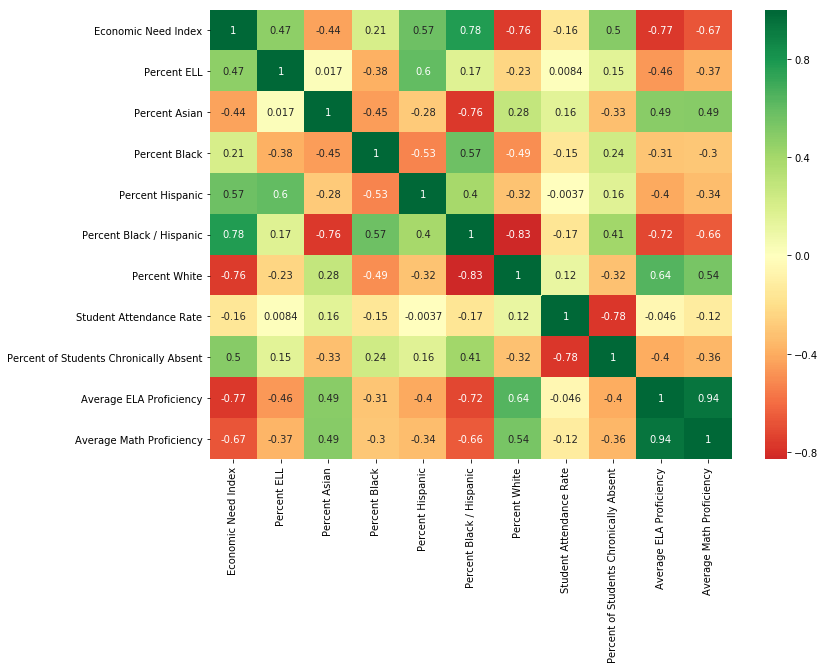
Correlation Matrix
Here we can see what dimensions of this data set are correlated to eachother based on the color. The actual correlation values are also depicted within the square. The following are some useful takeaways:
Economic Need Index
- Schools with more Black/Hispanic Students have a higher economic need index
- Schools with more White students have a lower economic need index
- Schools with low scores on ELA and Math have a higher economic need index
- Schools with more English Language Learners (ELL) have a slightly higher economic need index
- Schools with more students chronically absent have a slightly higher economic need index
Average ELA/Math Proficiency
- Schools with high Math proficiency almost always have high ELA (.94 correlation)
- Schools with more Black/Hispanic students have a lower ELA proficiency
- Schools with more White or Asian students have a slightly higher average ELA and Math proficiency
- Schools with more Black/Hispanic students have a slightly lower Math proficiency
Using Economic Need as a Proxy
The hard truth is that the economic need of students who are Black and Hispanic is very high. The following graph shows the economic need of a the schools indicated by color and the income of the school indicated by size of bubble.

Now the following graph includes race as a dimension. The size of the of the bubble still indicates school income but the color indicates race. We see that the areas of the map that were highlighted in the initial graph are still highlighted showing that these Black and Hispanic schools make up majority of the schools with high economic need.

There is a ripple effect of disadvantage caused by economic need as this spills into all aspects of the child's life and is reinforced by the similarly underserved communities and schools. The goal is to increase equity so that everyone has a fair chance of acceptance into a specialized high school, regardless of the economic situation these students are born into. Below we see can see how high Economic Need Index (ENI) is correlated with low ELA and Math scores.
| Average Math Proficiency | Average ELA Proficiency | |
|---|---|---|
| High ENI | 2.261688 | 2.247792 |
| Low ENI | 3.422083 | 3.267917 |
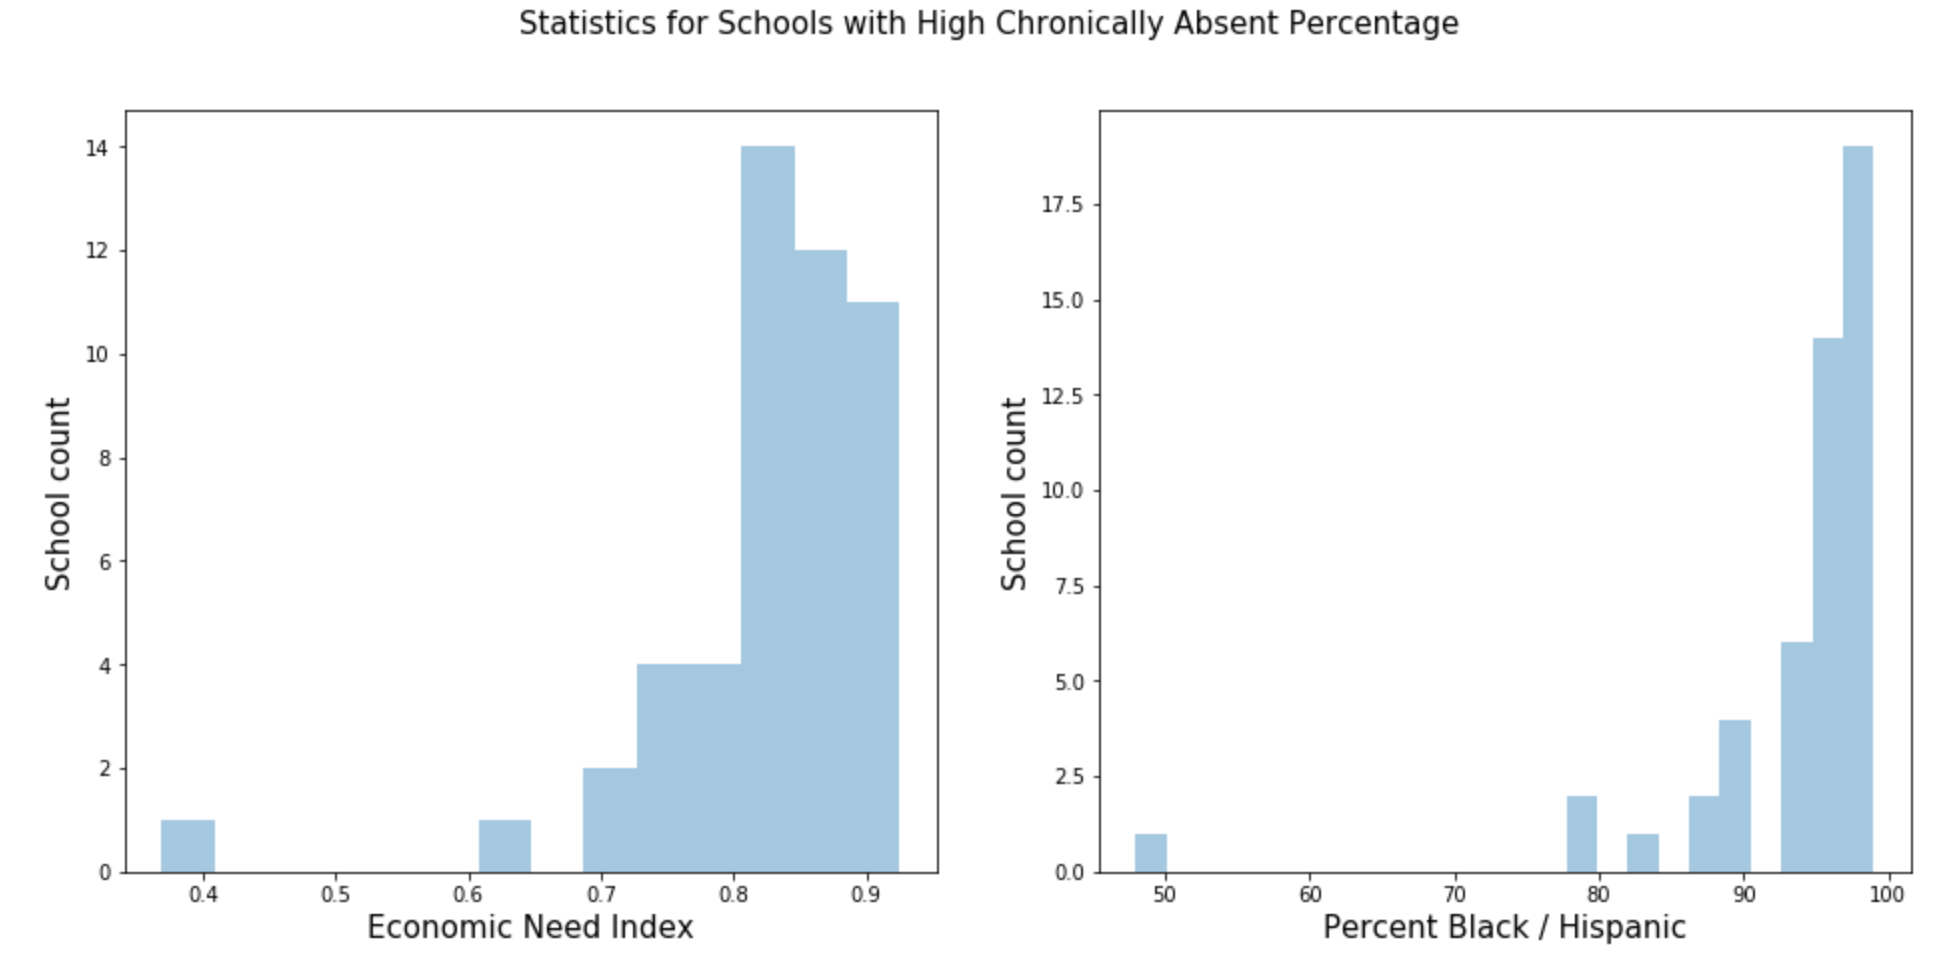
Adressing Chronically Absent Students
One aspect of the dataset indicates the percentage of students who are chronically absent, which in this case means absent 10% or more days of the school year. This is an important metric because the ability to help a student succeed in school is an impossible task if the students are not showing up. Again we see that economic need is an indicator of this.
SHSAT Participation Breakdown
One of the datasets we are considering contains data on Central Harlem (District 5) data from the NYC Department of Education. This set includes SHSAT registrations & participation for that community. Since the goal is to improve SHSAT participation it is vital for us to analyze this so we can target schools with low turnouts for the exam.
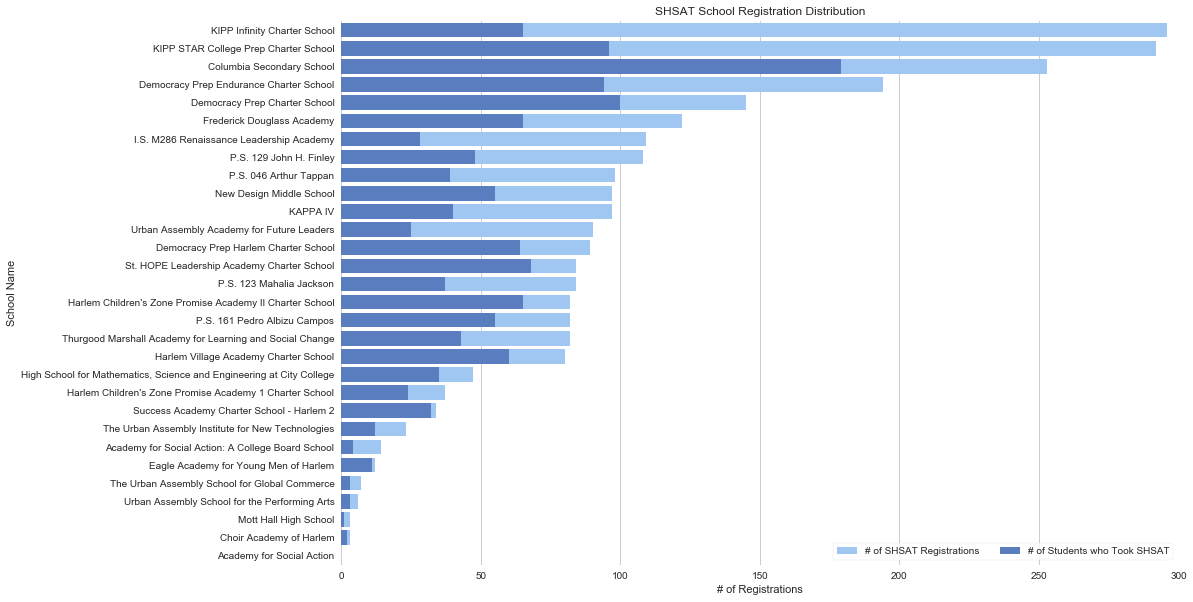
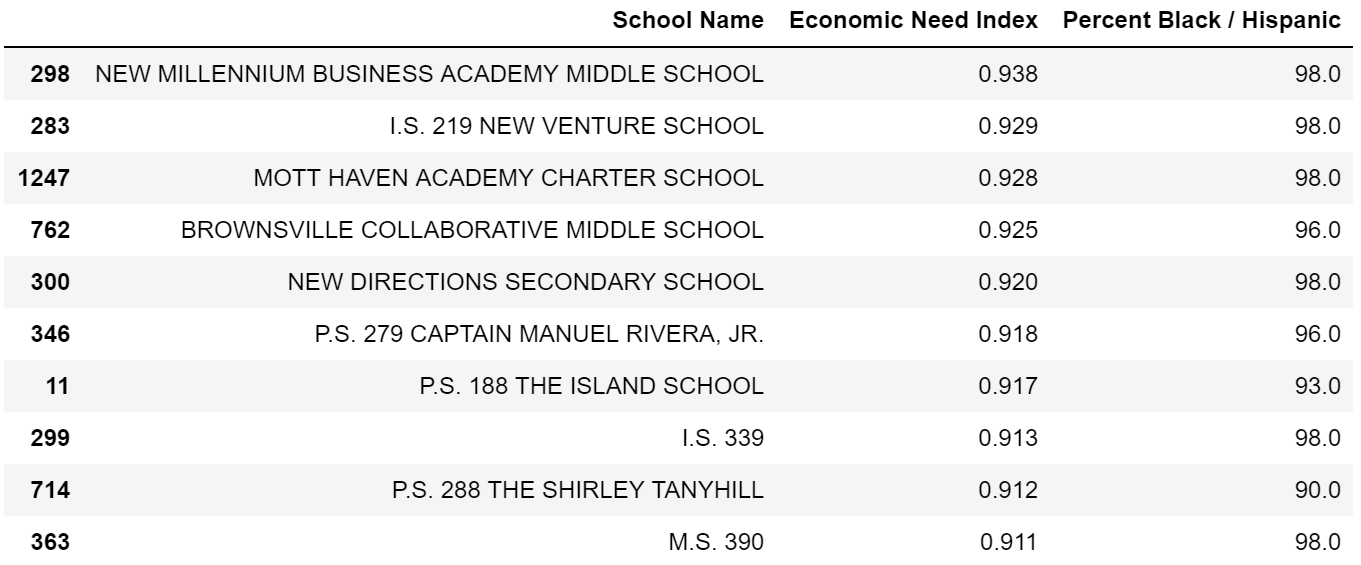
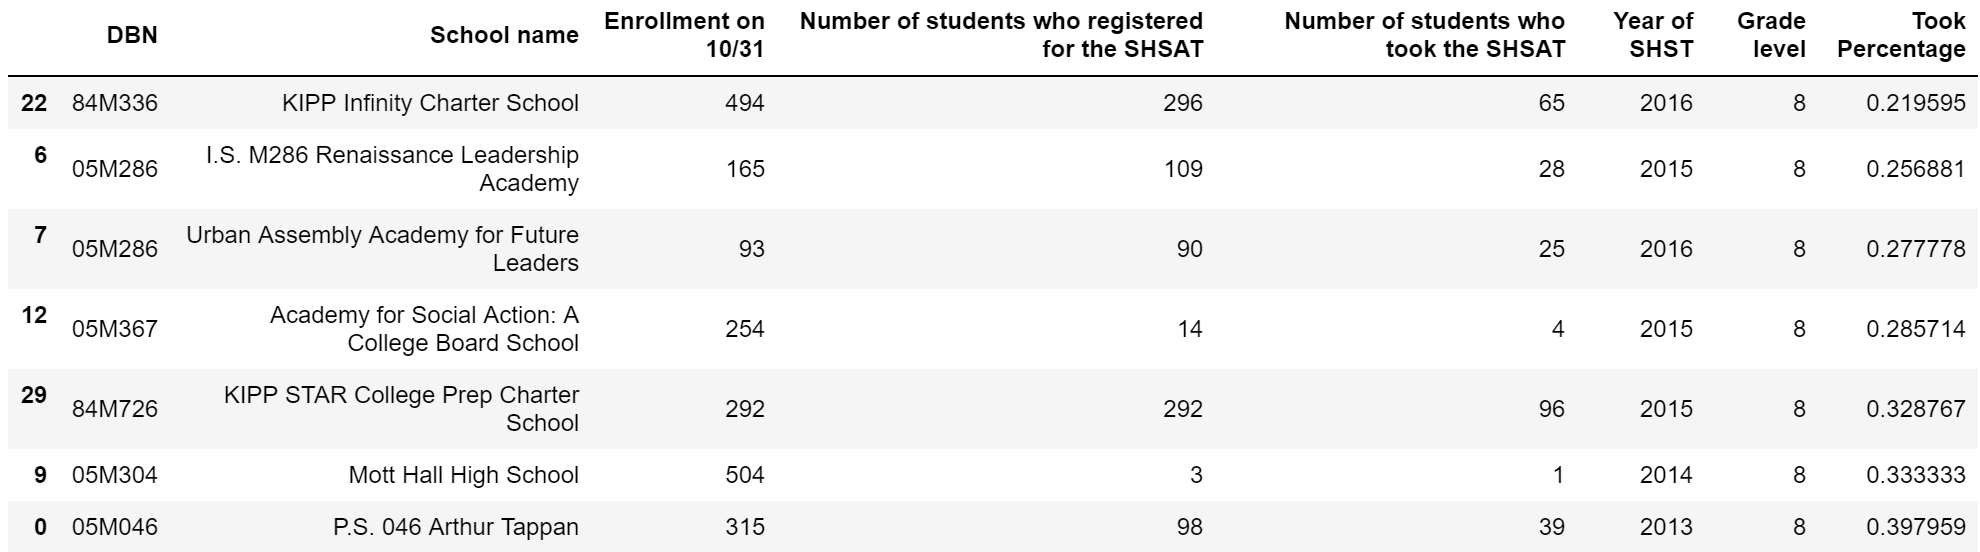
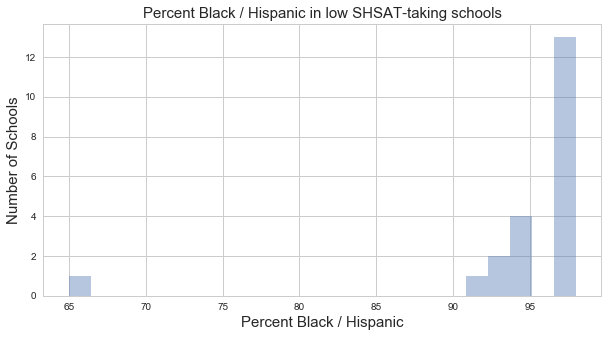
Below is a list of schools with less than 40% taking the SHSAT. These schools need to be addressed by PASSNYC. There are several students who could potentially pass the SHSAT if they had greater encouragement to take the exam that they registered for. We also find that many of these schools with low turnout tend to have a majority Black/Hispanic population, so targeting these schools would greatly aid the goal of improving diversity.
Recommendations to PASSNYC
I believe that we should combine Test Prep with Resources for Parents. The reason for this is that the students who would benefit from test prep and tutoring would first need their parents seeked out and provided with information so they can encourage their children to take the exam. Additionally After School Programs and Mentorship should be combined. The students that would benefit from after school programs are also likely in need of mentorship as well because the system is failing to aid them adequately during school.
Test Prep/Tutoring and Resources for Parents
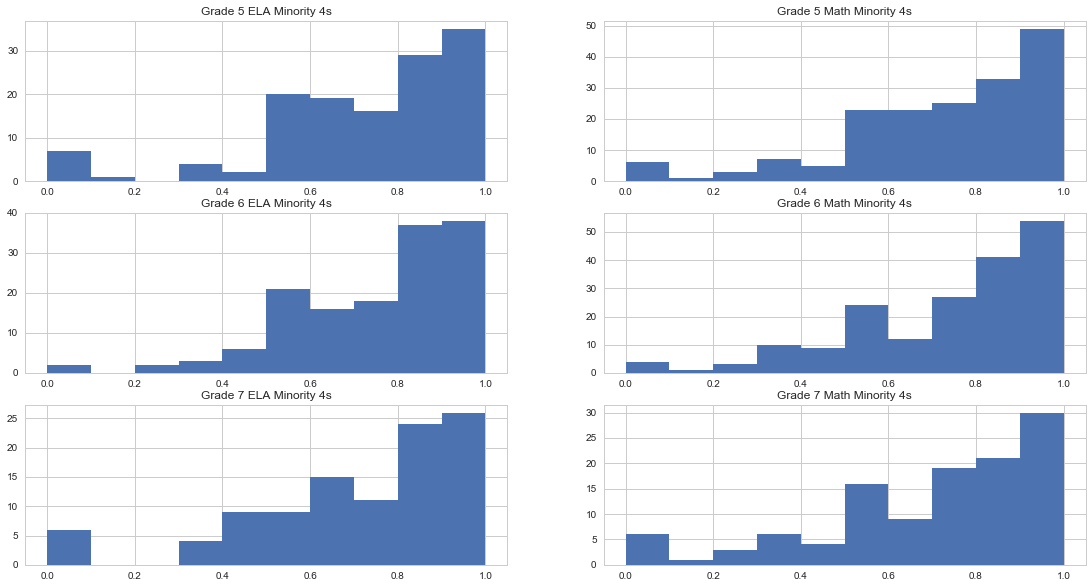
We start out by separating the set of schools into schools which have a majority Black and Hispanic population, as well as more than 4 students scoring 4s on Math and ELA. Additionally we will limit the scope of schools to just grades 5, 6, and 7. As we can see below there are several schools where students are very likely to pass the SHSAT given some preparation and resources. These are the students with the highest current potential to make progress towards the goal of PASSNYC.
After School Programs/Mentoring
To aid students with the greatest need for mentorship and after school programs, we first must find which schools are performing poorly. In the following heat map we can see a great amount of correlation between certain metrics assessing the quality of the relationship between students, teachers, and parents. We find that the highest correlation is between Effective School Leadership, Collaborative Teachers, and Trust.
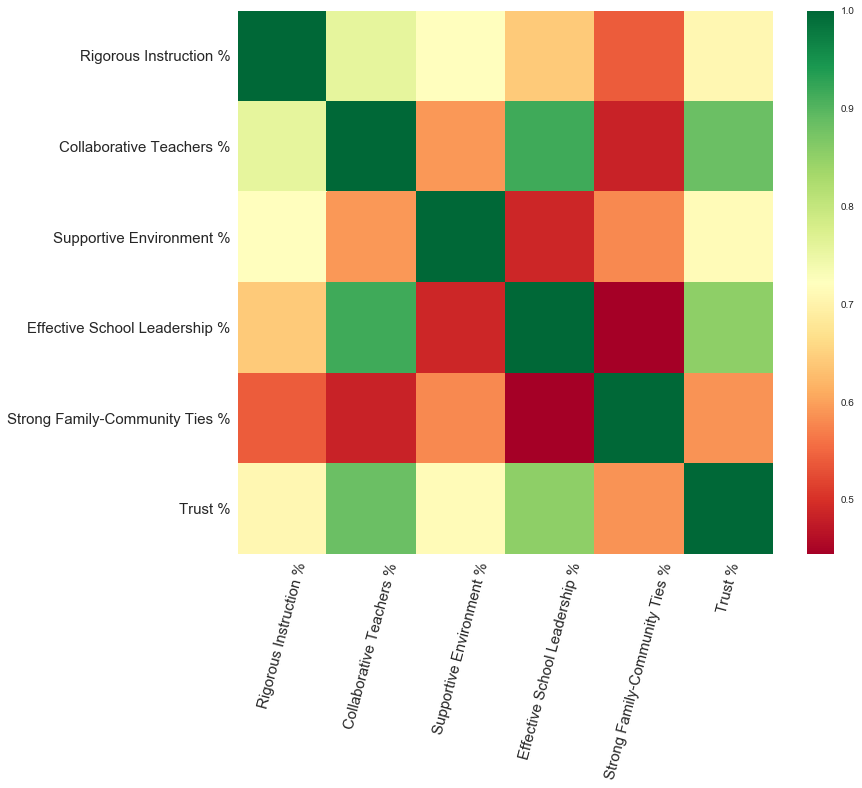
Now that we know these features are correlated, we can perform a Principal Component Analysis (PCA) to reduce these three highly correlated features into one combined metric. Additionally the other features have weights applied to them such as supportive environment (1.0), rigorous instruction (0.8), PCA combined feature (0.7) and strong family-ties(0.5). These weights are applied to result in one final School Performance Index (SPI). A sample of what this looks like is shown below.
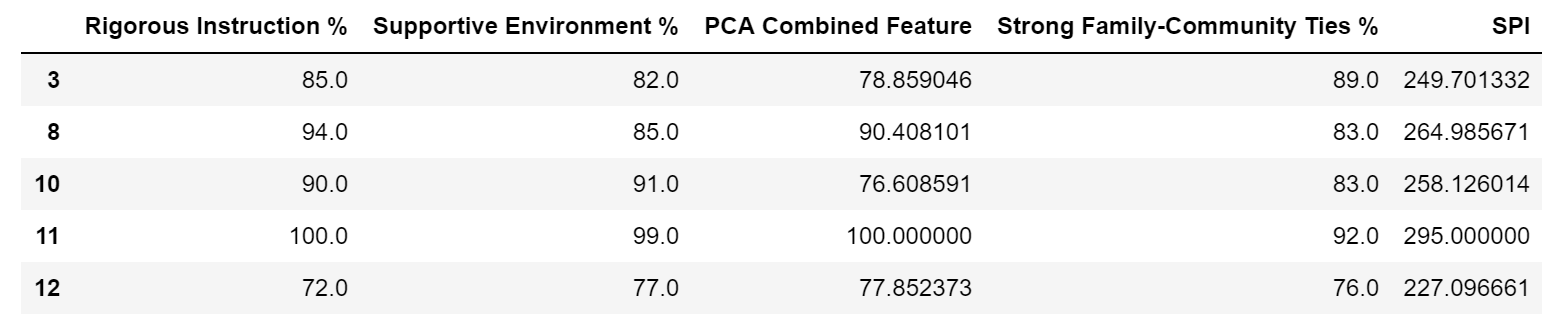
We then separate the schools into quantiles and find the low quantile of the SPI schools. These are schools with the greatest to gain from Mentorship and After School Programs. Attached in the sidebar are two files with the final lists of schools I recommend for the different PASSNYC services. Using data, hopefully we can make a difference in these students lives.
Notes
- The original problem and dataset can be found here on Kaggle.
- The source code for this analysis can be found on this Jupyter Notebook.
- The final recommendation for Test Prep and Tutoring/Resources for Parents & After School Programs/Mentorship can be downloaded following the respective link