Forecasting Avocado Prices
by Omar Baig
Posted on October 22, 2018 at 2:28 PM
Estimated Reading Time: 5 minutes

Prices go up and they go down. It can be hard to make sense of their trends. However, using forecasting, we can make predictions on all sorts of future events. In this analysis, using a historical data set of avocado prices, we can predict what the prices may be in the future.
Typically when we think of forecasting…
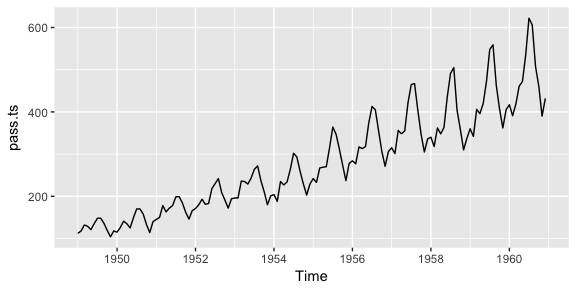
We think of weather forecasting. Weather patterns and temperatures are predicted using historical data. This is the same type of forecasting we are talking about here. It can be done to predict all types of things like the heights of ocean tides or even the closing value of the Dow Jones Industrial Average.
How is weather related to the stock market?
What these types of predictions have in common is that they are based on time-series data. Time-series data is data based on a series of discrete, equally spaced points in time. Any domain which has data like this has benefits to gain by forecasting. The idea is that meaningful statistics and characteristics become apparent when analyzing this type of data.
Why use time-series forecasting instead of regression?
Regression predicts the value of a number in a hypothetical future event. Forecasting uses a compiled timeline of data moments (like transaction history) to then tell you how it will continue into the future along those trends. One doesn’t replace the other, they are simply just used in different cases. With data that spans a long period of moments, you have more to gain with forecasting.
Introducing: Prophet
For years, forecasting has been something that is difficult to implement due to all kinds of unique anomalies that occur in each respective domain. Recently, there have been advancements with an open source library called Prophet (developed by Facebook). Prophet takes into consideration the typical issues that arise when forecasting. It has now become much more approachable by data scientists as a lot of the heavy lifting has been worked out under the hood. Now a careful analyst can make the adjustments they need to and get the forecast made with much less potential for inaccuracies. To learn more about how the software works you can read their work here.
Lets Get Started
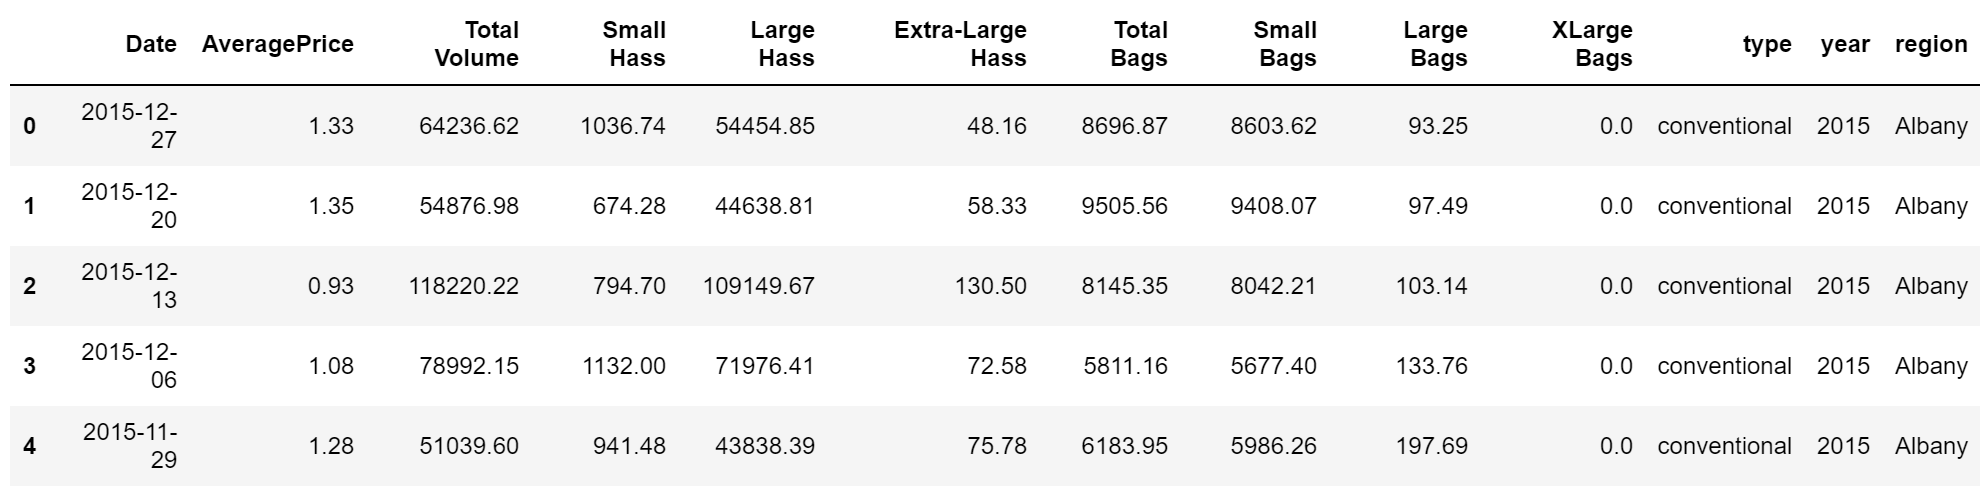
Here we have a data set provided by Kaggle of historical avocado prices. This data set is perfect for forecasting because the data is organized so that the prices are based on discrete points of time which are broken up by region. One region included in the data set is “Total US” so for the sake of making a useful generalization we will stick to this region. This data needed some minor cleaning to work with Prophet and the source code for what exactly was done to it can be found in the sidebar. The table also includes data about organic and conventional avocados. This is another dimension we can use to gain insight. Let's try to find out if we can predict prices for organic and conventional avocados! To do this we will perform two separate forecasts on each one.
Conventional vs Organic
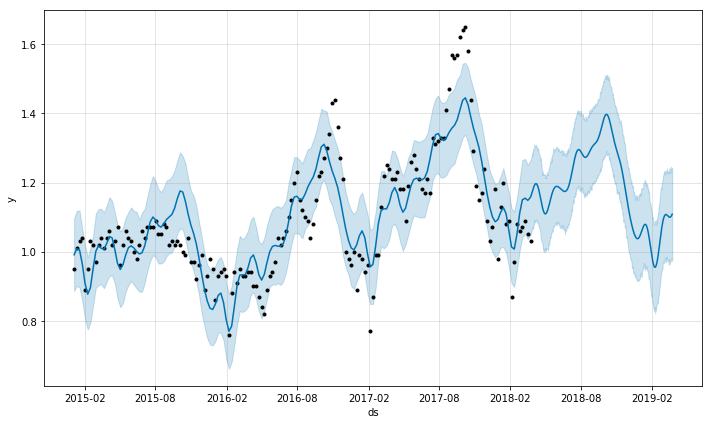
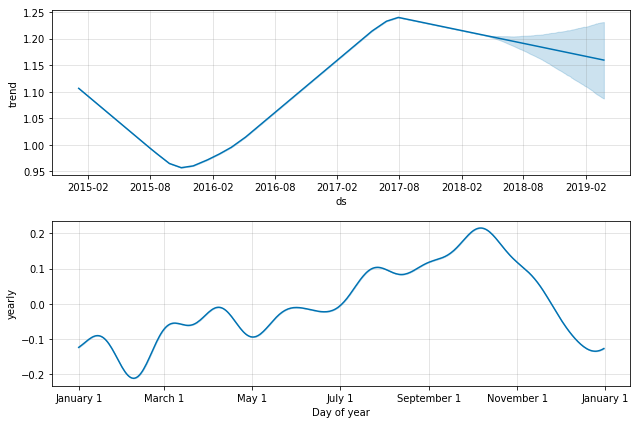
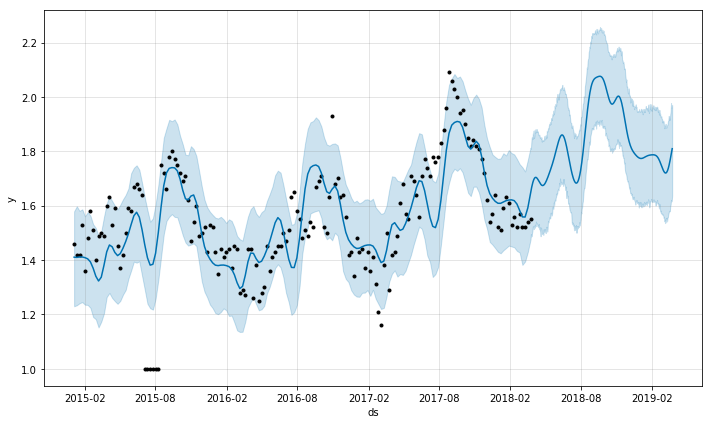
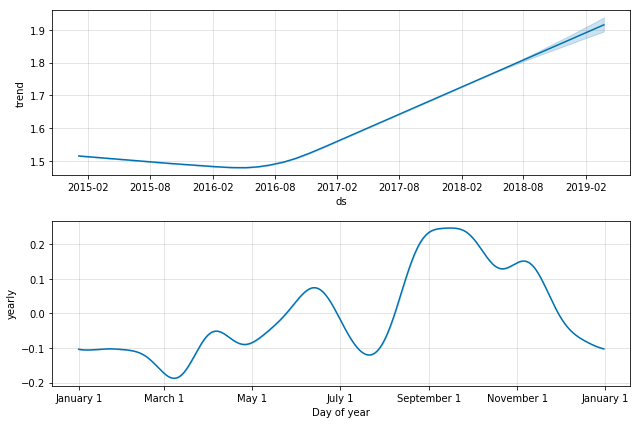
The graphs below are the output of Prophet. The upper graph shows the final forecast results, with the bottom two graphs showing the forecast broken down into its trend and yearly components.
Conventional
- There is a cycle that repeats itself. This cycle starts in February and lasts until November.
- Prices peak in October/November and are at the lowest in February.
- In the known area the data seems to be trending upwards but there is evidence of potential to fluctuate.
- One year from the final data point, we can expect avocados to be valued at ~$1.10.
Organic
- Similar cycle as conventional with regards to price peaks and troughs.
- Prices peak in September/October and are at lowest in March (this suggests that the season is shorter for organic).
- Smaller price fluctuations than conventional but a much higher overall cost.
- Price is undeniably trending upwards.
- One year from the final data point, we can expect avocados to be valued at ~$1.80.
Conclusion
As we can see there are some interesting takeaways from forecasting this dataset. Less obvious patterns become more apparent when forecasting. There are smaller, subtle differences that can only be found by analyzing the data closely. For a large organization, the small differences become much larger at scale so taking time to forecast can greatly improve decision making potential.
Notes
- The original problem and dataset can be found here on Kaggle.
- The source code for this analysis can be found on this Jupyter Notebook.